Contents
DAPASA: Detecting Android Piggybacked Apps through Sensitive Subgraph Analysis
Published in: IEEE Transactions on Information Forensics and Security ( Volume: 12 , Issue: 8 , Aug. 2017 )
Related Work
Piggybacked APP
- 负载APP:向良性APP负载(piggyback)恶意payload
- 良性APP载荷:carrier;恶意负载payload:rider
- 参考文献:4, 5, 8, 9, 22, 23, 24, 25
基于图结构的分析
-
identification of similarities in graphs is difficult
-
相关参考文献
-
[26] (function-call graph):embedding of function-call graphs with an explicit feature map
[26] H. Gascon, F. Yamaguchi, D. Arp, and K. Rieck, “Structural detection of android malware using embedded call graphs,” in Proc. AISec, 2013.
-
[27] - [30](program dependence graphs)
[27] C. Yang, Z. Xu, G. Gu, V. Yegneswaran, and P. Porras, “Droidminer: Automated mining and characterization of fine-grained malicious behaviors in android applications,” in Proc. ESORICS, 2014.
[28] X. Sun, Y. Zhongyang, Z. Xin, B. Mao, and L. Xie, “Detecting code reuse in android applications using component-based control flow graph,” in Proc. SEC, 2014.
[29] L. Deshotels, V. Notani, and A. Lakhotia, “Droidlegacy: Automated familial classification of android malware,” in Proc. PPREW, 2014.
[30] K. Chen, P. Liu, and Y. Zhang, “Achieving accuracy and scalability simultaneously in detecting application clones on android markets,” in Proc. ICSE, 2014. -
DroidSIFT(weighted contextual API dependency graph)
[21] M. Zhang, Y. Duan, H. Yin, and Z. Zhao, “Semantics-aware android malware classification using weighted contextual api dependency graphs,” in Proc. CCS, 2014.
-
MassVet(models the app’s user interfaces as a directed graph): identify piggybacked apps
[31] K. Chen, P. Wang, Y. Lee, X. Wang, N. Zhang, H. Huang, W. Zou, and P. Liu, “Finding unknown malice in 10 seconds: Mass vetting for new threats at the google-play scale,” in Proc. Security, 2015.
-
DAPASA流程(5步)
-
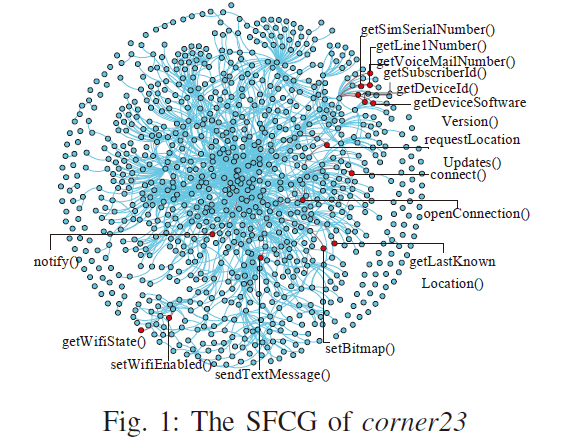
构造一个给定APP的静态函数调用图(SFCG: Static Function-Call Graph):有向图,其中节点表示APP调用的函数,边表示这些函数之间的调用关系(caller => callee)。

-
区分不同敏感API的恶意程度:通过一种类似TF-IDF的度量方式来计算每个敏感API的敏感度系数(sensitivity coefficient)。
公式3- 敏感API来源:Pscout(
参考文献36),共680个。 - 良性应用是分(26个)类别处理的。此部分使用来自VirusShare的恶意样本(任意)6154个。
- 敏感API来源:Pscout(
-
APP恶意程度的表示:将SFCG启发式地划分为一组带有敏感API节点及其邻近正常节点的子图集合(SGS: subgraph set)。(
算法1)- 主要思想:SFCG节点间可以计算出一个平均距离,一般为3~5;以敏感API为中心,小于平均距离(算法1中即小于等于2)的节点被划分进来,形成子图。其中距离为两个节点之间最短路径的长度。
- RemoveLibNodes: 删除第三方库节点(60,729种,
参考文献43、44)
-
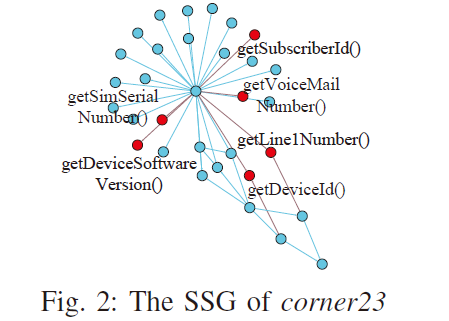
选择灵敏度系数最高的子图作为敏感子图 (SSG: sensitive subgraph)。(
算法2)-
主要思想:将包含相同敏感API的SG合并,确保一个敏感API只出现在一个子图中;对合并后的每个SG计算敏感度系数,取最大的作为SSG。
注:若一个App不包含敏感API,则没有SSG

-
-
从敏感子图中构造5个特征输入机器学习算法:敏感子图的
-
\(f_1\) 敏感度系数(sensitive subgraph):scg(SSG)
- 恶意度(负载APP的SSG的恶意度应该高于良性APP)
- 图中所有敏感API的敏感度系数之和
-
\(f_2\) 总敏感距离(total sensitive distance):tsd(SSG)
- 敏感API恶意度的内聚性(rider中的敏感API的内聚性通常高于carrier)
- 敏感API节点 \(s_i\) 到SSG中其他敏感API节点距离倒数的平均
公式6、7
-
\(f_3\) ~ \(f_5\) 敏感模式出现的次数(Totxal Number of Sensitive Motif Instances):tnsm(SSG)
-
敏感API节点和正常节点之间调用模式,反映不同的恶意行为
-
没有互边的情况下,一个网络中的三个节点存在四种调用模式;去除Z分数小于0的,选了三种显著模式(significant motif)。
z分数(z-score),也叫标准分数(standard score),是一个数与平均数的差再除以标准差的过程。
这里是由于每个SFCG结构不同,所以对每个图统计每种模式出现次数时要做一个标准化,越大表示越significant。 -
敏感模式(sensitive motif)即至少包含一个敏感API节点的显著模式。
-
-
实验评估
数据集
- 2551个恶意负载APP(15个家族):1062个来源于Genome,1489个从VirusShare上下载(由`参考文献50`<famaily classification>标注)
- 44,921个流行的良性APP:12,001个(16类)来自Google Play,32,920个(10类)来自Anzhi
恶意负载应用检测
检测结果(四种分类模型)
- Random Forest, Decision Tree (C4.5), k-NN(k=1) and PART
- 10折交叉验证:真阳性率为95%,假阳性率为0.7%,AUC为0.99。
所有数据都放入训练,没有划分测试集!
与三种Baseline方法的比较
- [16]:requested permissions
本文三作14年的文章 - [33] DroidAPIMiner
- AUC都是0.99
但实际上观察Fig.9,[33]的AUC曲线略优 - 特征:DAPASA只包含五个数值,而
[33]permission (88) + API (680) + graph based (32,768)
- AUC都是0.99
- [26]:embedded call graph
对某些混淆方法更鲁棒?
其它评估
运行开销
结果图中x轴表示App的大小,y轴表示运行的时间开销
- 反编译:与源码逻辑的复杂程度更相关,而非大小(符合事实)
- 图分析:与App大小呈线性关系
- 特征计算:与App大小无关,应与SSG的大小更相关
开销比较:[26] > DAPASA > [16] [33]
特征分析
只做了三组,从图看tnsm较tsd能带来较大提升:scg、scg+tsd、scg+tsd+tnsm- 组合特征的效果(
D: DAPASA,P: permission,S: API):D+P » P,D+S > S
